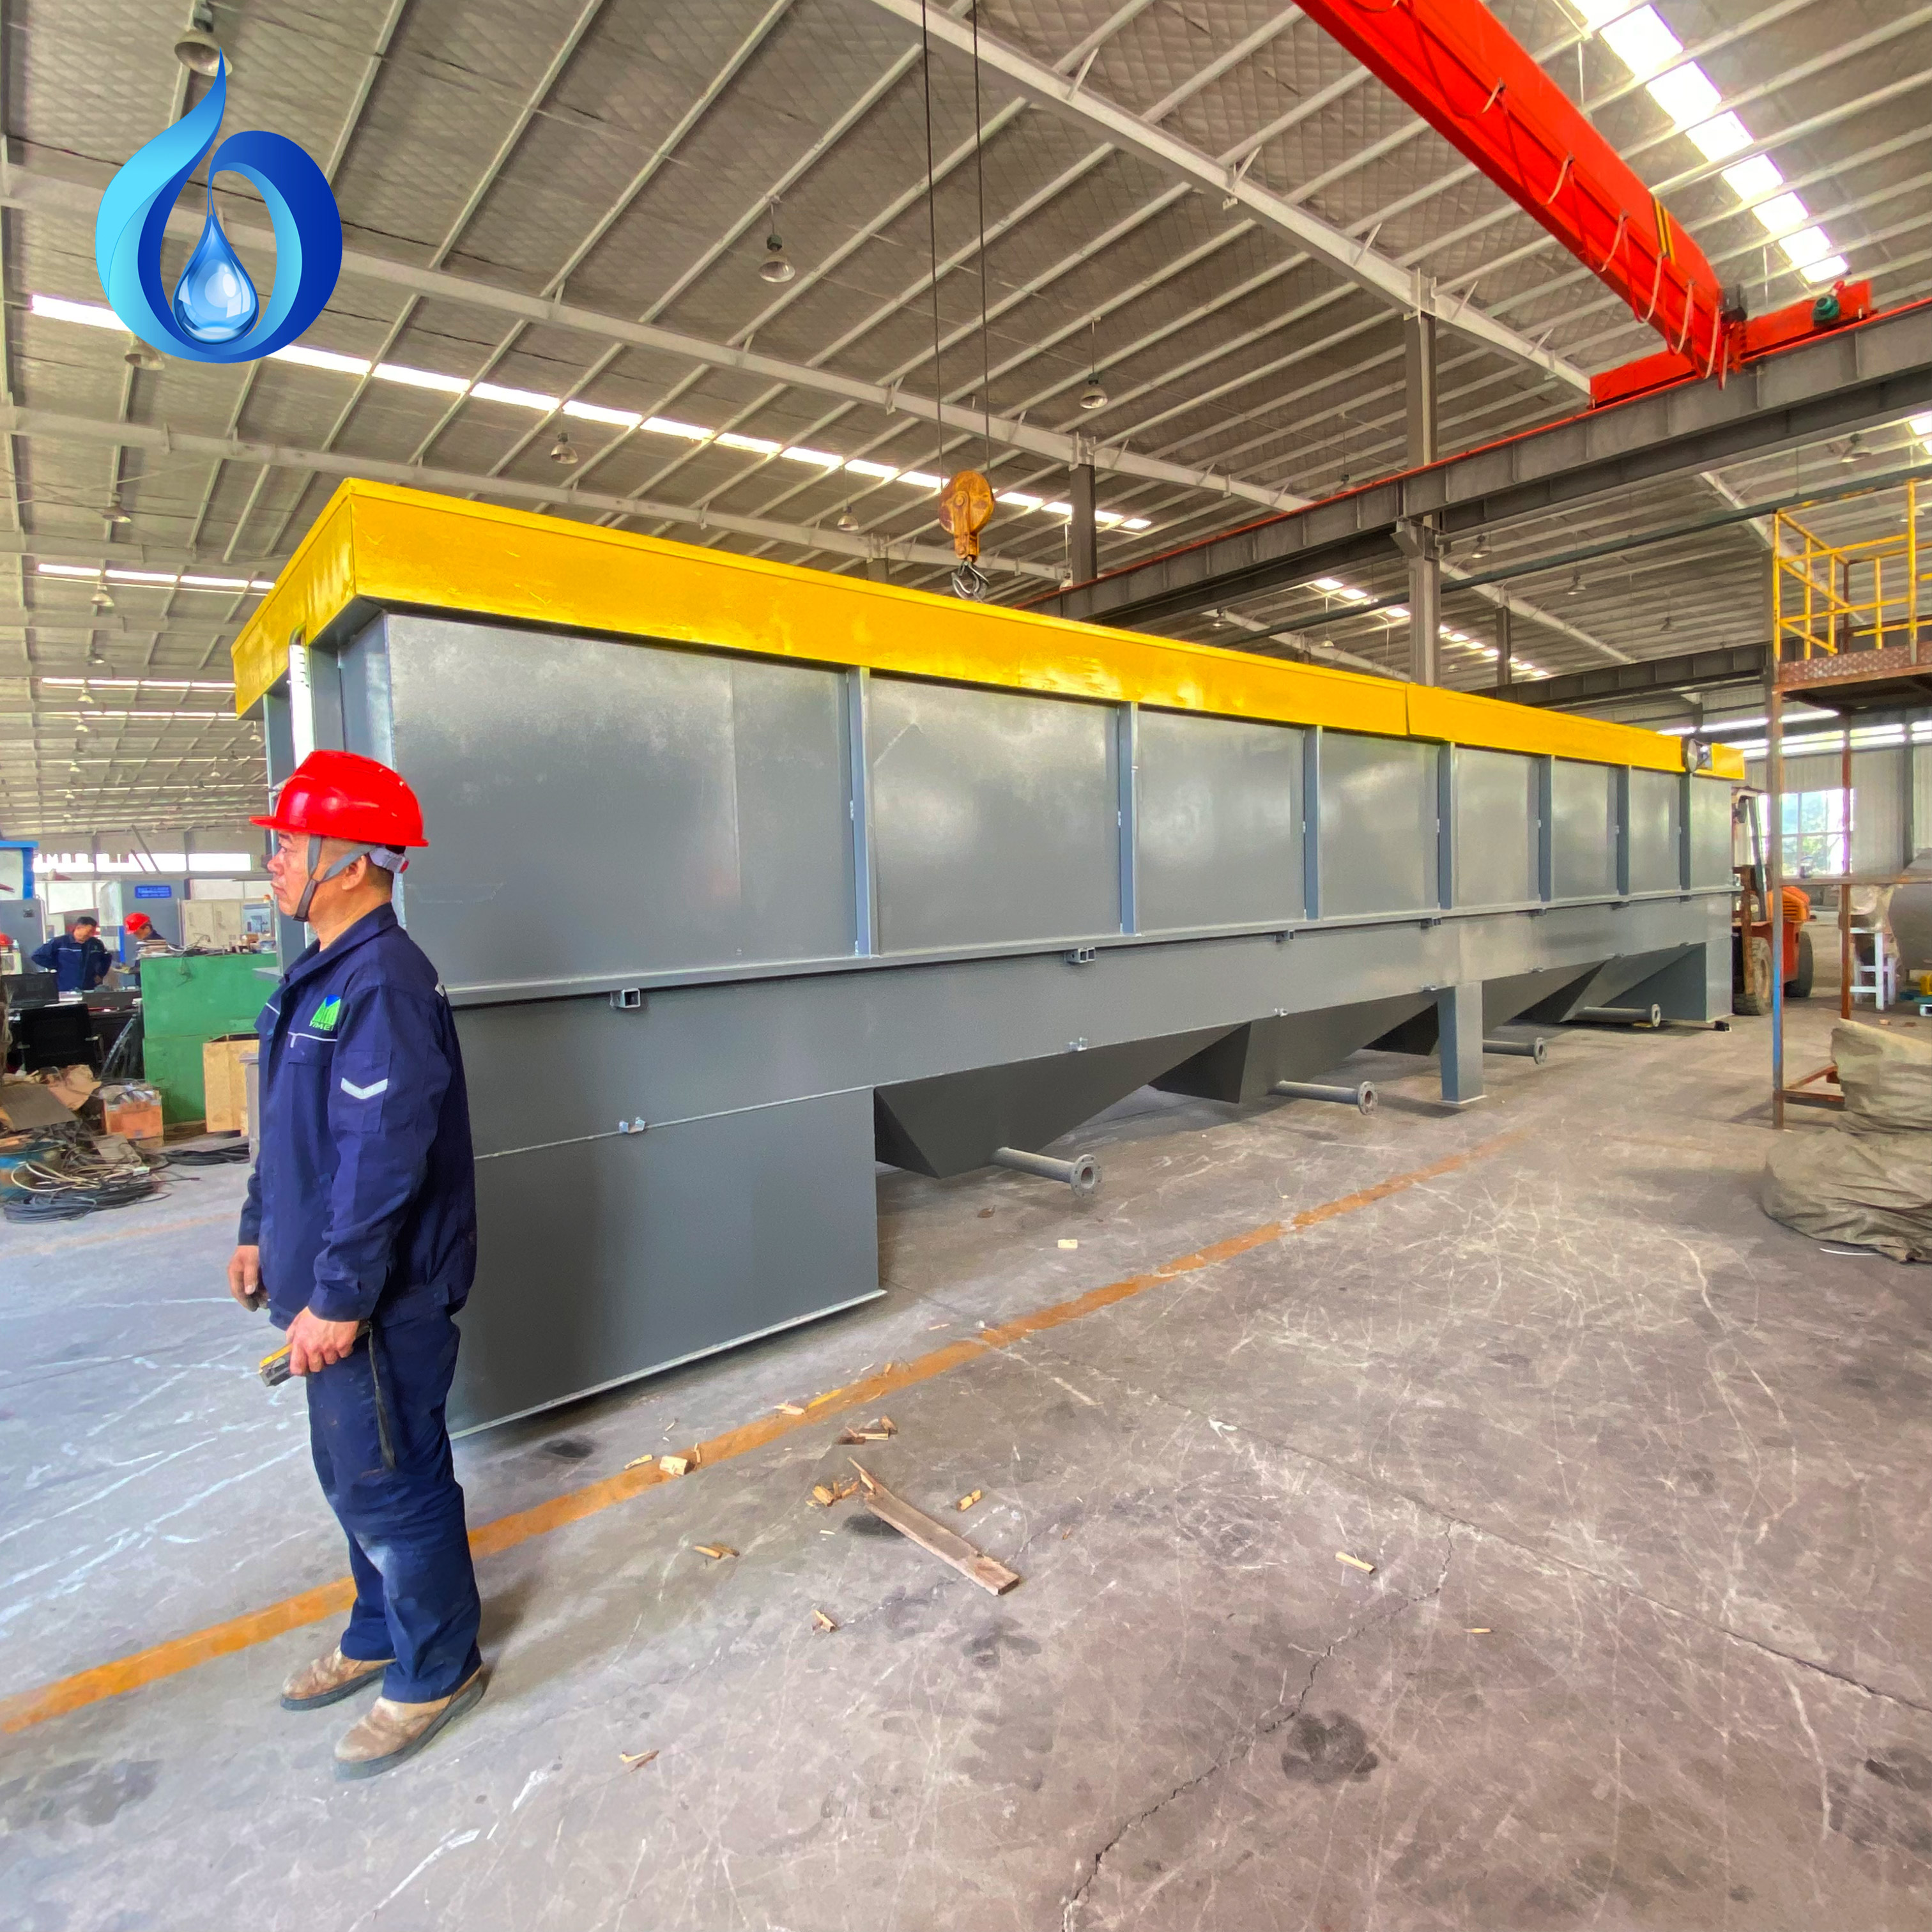
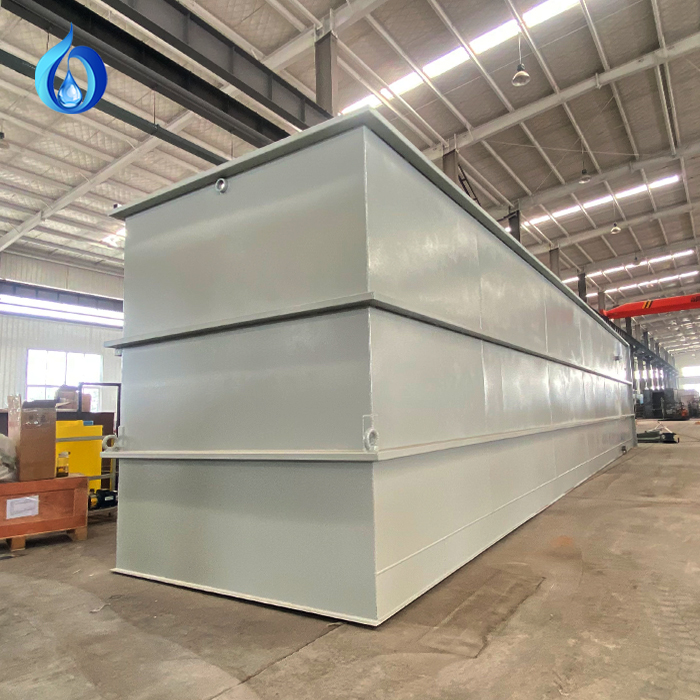
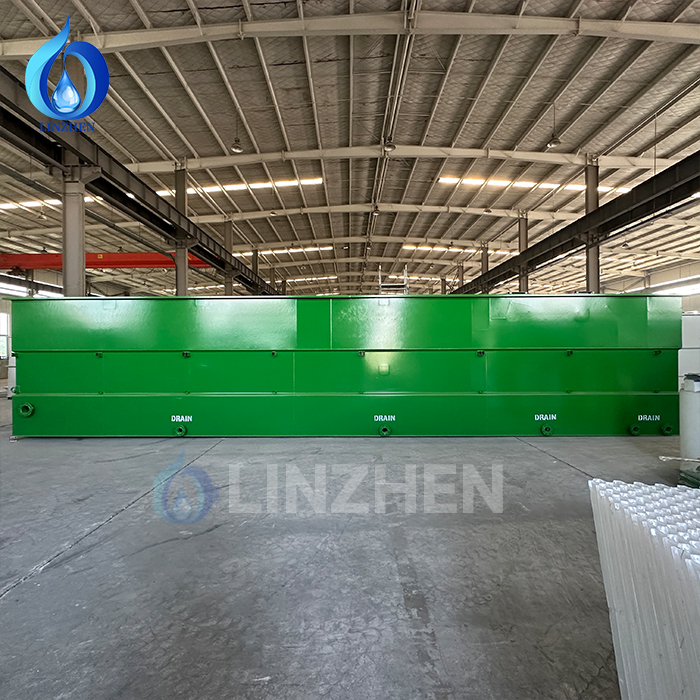
Determining the payback time for a wastewater recycling system in brewery operations requires careful analysis of capital investment, operational savings, and industry-specific factors. Breweries consume enormous quantities of water during production, cleaning, and cooling processes, making a wastewater recycling system an increasingly important financial consideration. Understanding how to calculate and evaluate payback time helps brewery owners make informed decisions about this significant capital expenditure. The payback period directly reflects whether your wastewater recycling system investment aligns with business growth objectives and cash flow capabilities.
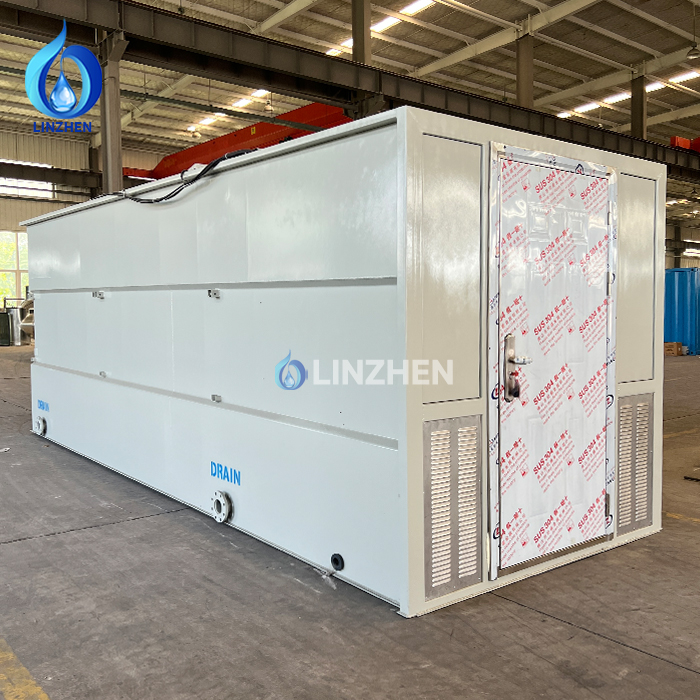
The payback time calculation for a wastewater recycling system depends on multiple interconnected variables including installation costs, water pricing in your region, production volume, regulatory compliance expenses, and maintenance overhead. Most brewery operations see payback periods ranging from three to seven years, though this timeline varies significantly based on facility size, existing infrastructure, and local water tariffs. By systematically analyzing each cost component and revenue stream, breweries can project realistic payback scenarios and determine whether a wastewater recycling system fits their strategic and financial planning.
Core Financial Components of Wastewater Recycling System Payback Analysis
Initial Capital Investment and Installation Costs
The upfront capital required for a wastewater recycling system represents the largest single factor in payback calculations. Your total investment encompasses equipment purchase, site preparation, piping installation, control systems, and commissioning activities. A typical wastewater recycling system for medium-scale breweries ranges from $200,000 to $500,000 depending on treatment capacity and technology sophistication. Understanding these baseline costs provides the foundation for all subsequent payback projections and financial modeling.
Beyond direct equipment expenses, breweries must account for engineering consultation, permitting fees, and contingency reserves when budgeting for a wastewater recycling system. Many facilities underestimate indirect costs associated with system integration into existing production layouts. Accurate cost estimation requires detailed facility assessment and equipment specifications tailored to your brewery's water consumption patterns. This comprehensive financial picture ensures your payback calculations reflect true total cost of ownership for the wastewater recycling system.
Annual Operating and Maintenance Expenses
Operating expenses for a wastewater recycling system include energy costs, chemical additions, operator labor, and preventive maintenance. Most treatment systems consume 20 to 40 kilowatt-hours per thousand gallons processed, creating significant ongoing electricity charges. Chemical costs for pH adjustment, disinfection, and particulate removal add another $0.10 to $0.25 per thousand gallons to operational overhead. Realistic payback modeling requires detailed tracking of all wastewater recycling system operational expenses across a full annual cycle to capture seasonal variations and maintenance requirements.
Water Savings and Revenue Drivers for Payback Calculations
Fresh Water Cost Reduction and Consumption Impact
The primary financial benefit of a wastewater recycling system comes from reduced fresh water purchases and associated sewer discharge fees. Breweries typically recycle 30 to 50 percent of process water through an effective wastewater recycling system, translating to substantial monthly savings depending on local water pricing. In regions where water costs exceed $4 per thousand gallons, recycled water from a wastewater recycling system delivers approximately $120 to $200 per thousand gallons annually in combined water and sewer savings. This direct cost reduction forms the cornerstone of payback period projections.
Municipal water rates, drought surcharges, and effluent fees vary dramatically across brewing regions, creating significant variance in wastewater recycling system payback timelines. Facilities in water-scarce areas experience faster payback because their wastewater recycling system achieves higher per-gallon savings. Conversely, breweries in regions with abundant cheap water face longer payback periods unless they pursue sustainability-driven premium pricing strategies. Accurate payback calculations require current local water authority tariff schedules and five-year rate escalation projections for your wastewater recycling system analysis.
Sustainability Incentives and Regulatory Compliance Value
Many jurisdictions offer tax credits, rebates, or low-interest financing programs for breweries that implement a wastewater recycling system. These incentives can reduce effective capital costs by 10 to 30 percent, substantially improving payback timelines. Additionally, a wastewater recycling system often helps breweries meet stricter environmental discharge regulations, avoiding potential fines or production restrictions. Regulatory compliance value, though harder to quantify monetarily, represents a significant component of true payback calculations for wastewater recycling system investments.
Premium positioning and brand enhancement associated with sustainable production practices can generate indirect revenue benefits for breweries operating an advanced wastewater recycling system. Consumer preference for environmentally responsible brands creates market differentiation value that partially offsets capital investment. Some breweries incorporate their wastewater recycling system investment into marketing narratives, building customer loyalty through transparency about water stewardship. These intangible benefits support longer-term payback justification beyond pure water cost mathematics for wastewater recycling system implementations.
Calculating and Modeling Payback Time for Wastewater Recycling System Investment
Fundamental Payback Period Formula and Scenario Analysis
The basic payback calculation divides total wastewater recycling system capital investment by average annual net savings. For example, a $350,000 system generating $70,000 in annual water savings minus $15,000 in operating costs yields a net annual benefit of $55,000, producing a five-year payback period. This simplified approach provides useful baseline estimates but requires adjustment for inflation, interest costs, and system degradation over time. More sophisticated financial modeling incorporates discounted cash flow analysis to account for time value of money when evaluating wastewater recycling system payback performance.
Breweries should model multiple scenarios reflecting different water price assumptions, production volume projections, and operational efficiency outcomes to understand payback sensitivity. Conservative scenarios assume slower water cost increases and higher maintenance expenses, producing longer payback timelines for the wastewater recycling system. Optimistic scenarios incorporate regional water shortage premiums and lower-than-expected operating costs, accelerating payback. This range of projections helps brewery management understand realistic payback outcomes and risk factors specific to their wastewater recycling system investment decision.
Industry Benchmarking and Performance Metrics
Breweries should research industry payback benchmarks and case studies from comparable facilities to calibrate expectations for their wastewater recycling system investment. Large breweries with high production volumes typically achieve three to four year payback periods, while smaller craft operations often experience five to seven year timelines. Water-intensive processes like malt beverage production and cold conditioning show faster payback compared to lower-consumption brewing models. Understanding where your facility positions within these industry ranges helps validate whether your wastewater recycling system projections align with operational realities and peer performance data.
Key performance indicators for evaluating wastewater recycling system success include cost per gallon treated, water recovery percentage, and return on investment rate. Tracking these metrics against projections enables course correction and optimization throughout the system lifecycle. High-performing installations demonstrate cost per gallon below $0.15, water recovery rates exceeding 60 percent, and annual ROI surpassing 18 percent for their wastewater recycling system. Benchmarking actual performance against industry standards helps breweries maximize financial benefits and validate ongoing payback projections for wastewater recycling system operations.
Risk Factors and Payback Timeline Considerations
Operational Challenges Affecting System Performance
Real-world wastewater recycling system performance often varies from theoretical projections due to equipment reliability, operator experience, and process integration challenges. Membrane fouling, biological growth, and chemical imbalances can reduce treatment efficiency and increase operating costs beyond initial estimates. Breweries must budget contingency reserves for unexpected repairs or component replacements that impact the payback timeline for wastewater recycling system investments. Comprehensive operator training and preventive maintenance programs minimize these operational risks and protect projected payback performance.
Market and Regulatory Changes Affecting Long-Term Payback Value
Changing water regulations, evolving environmental standards, and fluctuating energy prices can significantly alter the financial payback trajectory for a wastewater recycling system. Stricter discharge regulations may increase the value of recycled water compliance benefits, accelerating payback timelines. Conversely, energy price declines could reduce operational savings, extending payback periods for wastewater recycling system investments. Breweries should incorporate sensitivity analysis for these external variables into their financial planning framework, ensuring wastewater recycling system decisions remain robust under multiple economic scenarios.
FAQ
What is the average payback period for brewery wastewater recycling systems?
Most brewery wastewater recycling systems achieve payback between three and seven years, depending on water costs, facility size, and production volume. Large breweries in high-cost water regions often see three to four year payback periods, while smaller facilities in low-cost regions may experience seven year or longer timelines. Your specific wastewater recycling system payback depends on detailed analysis of local water pricing, system configuration, and operational efficiency.
How do regulatory incentives affect wastewater recycling system payback calculations?
Tax credits, rebates, and low-interest financing programs can reduce effective capital costs by 10 to 30 percent for wastewater recycling system installations. These wastewater recycling system incentives significantly improve payback timelines and should be incorporated into financial modeling. Many jurisdictions offer these programs to encourage water conservation, making them crucial components of comprehensive payback analysis for brewery investments.
Should breweries account for intangible benefits when calculating wastewater recycling system payback?
Yes, sustainability branding, regulatory compliance value, and market differentiation contribute meaningful indirect benefits that extend beyond pure water cost savings. While harder to quantify precisely, these intangible factors strengthen long-term payback justification for wastewater recycling system investments.
 EN
EN